SpaceX IPO Volatility, U.S. Retail Sales Surge, and Key Central Bank Rate Holds Shape Markets
SpaceX IPO Volatility, U.S. Retail Sales Surge, and Key Central Bank Rate Holds Shape Markets
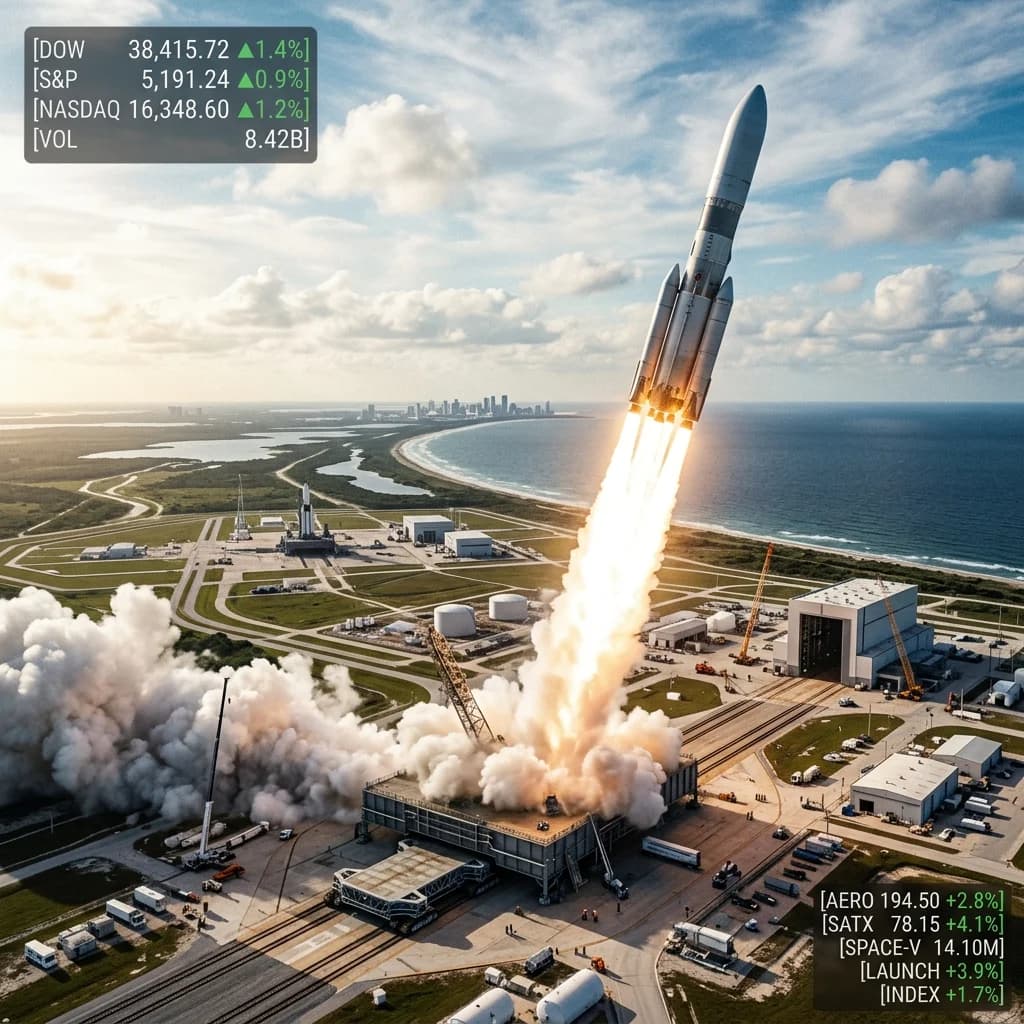
The third week of June 2026 delivered one of the most historically dense single-week combinations of market events: SpaceX (SPCX) listed on Nasdaq at $135/share and within 4 trading days hit a peak valuation of $2.97T (briefly the world's second-most-valuable company, ahead of Microsoft and Amazon), before a $60B all-stock Cursor acquisition knocked the market cap back to $2.37T on dilution concerns. The US May retail sales beat (+0.9% MoM vs +0.5% expected, totalling $763.7B) arrived at the worst possible moment for rate-cut optimists — strong consumer spending data confirms the economy is not cooling fast enough to justify Fed easing, aligning with 9/18 FOMC dot-plot projections of a further 25bp hike. And the Swiss National Bank (SNB) at 0.00% and Reserve Bank of Australia (RBA) at 4.35% both held — with divergent reasons: Switzerland holds because it succeeded in taming inflation; Australia holds because it paused its hike cycle but has not declared victory.
📈 SpaceX SPCX — The $2.97T Peak and the Cursor Acquisition
The Largest IPO in History and Its First Week of Trading
SpaceX IPO timeline:
| Date | Price/Valuation | Key event |
|---|---|---|
| June 12 | IPO priced at $135/share | Initial offering = $1.77T market cap |
| June 12 (open) | $150/share | +11.1% from IPO price at open |
| June 12 (close) | $160.95/share | +19.2% first-day gain → $2.11T market cap |
| June 13–15 | Institutional and momentum buying | Continued accumulation |
| June 16 | Peak: ~$227/share | $2.97T market cap — briefly #2 behind Apple |
| June 18 | Sharp correction | $60B all-stock Cursor acquisition announced |
| June 18 (close) | ~$182/share | $2.37T market cap — settled post-acquisition |
| June 19 (week close) | ~$178/share | Elevated volatility — index inclusion pending |
How SpaceX's $2.97T compares to global companies:
| Rank | Company | Market cap (approx., June 16, 2026) |
|---|---|---|
| 1 | Apple | $3.52T |
| 2 (temporary) | SpaceX (SPCX) | $2.97T |
| 3 | Nvidia | $2.85T |
| 4 | Microsoft | $2.53T |
| 5 | Alphabet | $2.41T |
| 6 | Amazon | $2.30T |
| 7 | Saudi Aramco | $1.85T |
The Cursor acquisition — $60B all-stock deal mechanics:
| Parameter | Value |
|---|---|
| Acquiree | Cursor (AI coding assistant, San Francisco) |
| Acquisition price | $60 billion (all-stock) |
| Payment structure | 100% SPCX shares — no cash |
| Share dilution | ~$60B / $2.97T market cap = ~2.0% dilution |
| Strategic rationale | Integrate AI coding across Starlink's global developer network |
| Cursor's last private valuation | ~$8B (2025) |
| Acquisition premium | 7.5× previous valuation |
Why the all-stock structure caused the correction: The $60B all-stock deal effectively means SpaceX is issuing new shares equivalent to 2% of its float:
- Dilution arithmetic: Each existing shareholder owns 2% less of the company after issuance
- Valuation anchor shift: The deal implied Cursor was worth $60B — making many analysts question if $8B was the right base, and if SpaceX was overpaying
- Lock-up concerns: Cursor's employees and investors received $60B in SPCX stock with lock-ups — once lock-ups expire, $60B in potential selling overhang
- Acquisition integration risk: Cursor has ~300 employees; integrating a software company into SpaceX's aerospace culture was immediately questioned
Why Cursor was strategically compelling for SpaceX: Cursor is an AI coding assistant (IDE built on VSCode) with:
- 1M+ active developers using Cursor daily
- Best-in-class "Tab" completion (generates 30–40% of code written in Cursor by accepted suggestions)
- Deep integration with Claude, GPT-4o, and Gemini models
For SpaceX, Cursor enables:
- Starlink developer ecosystem: Starlink is becoming a global internet provider (2M+ subscribers) — having the best AI coding tool embedded in Starlink's developer portal creates a tech moat
- SpaceX internal engineering: SpaceX employs ~12,000 engineers — Cursor across SpaceX's codebase = productivity multiplier
- Competitor to GitHub Copilot: Microsoft's GitHub Copilot (35M users) is a primary competition — SpaceX/Cursor creates a non-Microsoft alternative at massive scale
🛍️ US May Retail Sales — The Real Story Behind +0.9%
Parsing the $763.7B Number
Retail sales breakdown — all categories:
| Category | Apr 2026 | May 2026 MoM | May 2026 YoY | Note |
|---|---|---|---|---|
| Total retail & food services | — | +0.9% | +6.9% | $763.7B total |
| Gasoline stations | — | +3.4% | +8.2% | Price-driven, not volume |
| Core retail (ex-gasoline) | — | +0.7% | +6.5% | Better quality reading |
| Core (ex-auto + ex-gasoline) | — | +0.5% | +5.8% | "Control group" — Fed's preferred |
| Nonstore retailers (e-commerce) | — | +0.9% | +12.2% | Amazon, Shopify, direct DTC |
| Food services/drinking establishments | — | −0.4% | +5.1% | Consumers eating out less |
| Electronics & appliance stores | — | −0.8% | −1.2% | Consumer electronics demand falling |
| Department stores | — | −0.5% | −3.1% | Structural decline continues |
| Motor vehicles & parts | — | +0.4% | +7.8% | EV incentive-driven |
| Clothing & accessories | — | +0.3% | +3.4% | Stabilising |
The "real" retail sales — inflation-adjusted: Headline retail sales grew +0.9% MoM in nominal terms. But May 2026 headline CPI was +4.2% YoY. To estimate real (inflation-adjusted) retail sales:
- Monthly CPI: approximately +0.35% MoM (annualising at 4.2%)
- Real retail growth: 0.9% − 0.35% = +0.55% real MoM — still positive but less impressive
- The gasoline component: +3.4% MoM gasoline sales is almost entirely price, not volume (US gasoline demand is approximately flat YoY)
The Fed implication — why strong retail data is hawkish: The "control group" retail sales (ex-auto + ex-gasoline) at +0.5% feeds directly into the Fed's GDP forecasting model:
- Control group retail → feeds into personal consumption expenditures (PCE)
- Control group at +0.5% MoM → annualised PCE tracking at +6.0% (nominal) or ~+2.5% (real) — both above what the Fed needs to justify rate cuts
- 9/18 FOMC members already projected another 25bp hike — this retail data gives them more ammunition
E-commerce +12.2% YoY — the structural shift: The e-commerce category's +12.2% YoY growth (vs total retail +6.9%) confirms the structural shift:
- For every dollar of new retail spending growth, ~$0.60 goes to online channels
- This has implications for inflation: e-commerce has higher competition and lower prices than physical retail → suppresses goods inflation
- But logistics/warehousing employment growth creates wage pressure in the "last mile" delivery sector
🏦 SNB and RBA — Two Different Holds, Two Different Messages
Switzerland's Success vs Australia's Pause
Swiss National Bank (SNB) — 0.00% hold:
| SNB metric | Level (June 2026) |
|---|---|
| SNB policy rate | 0.00% |
| Switzerland headline CPI | +1.3% YoY (well within 0–2% target) |
| EUR/CHF | 0.940 (CHF slightly appreciated) |
| SNB intervention stance | "Increased willingness to sell CHF to prevent excessive appreciation" |
| Swiss trade balance | +CHF 4.1B/month (structural export surplus) |
Why Switzerland has 0% rates when everyone else is at 3–5%: Switzerland's structural advantages:
- Export pricing power: Swiss exports (pharmaceuticals, luxury goods, precision machinery) are priced inelastically — buyers pay regardless of CHF strength
- Energy independence (relative): 57% hydroelectric, 37% nuclear — minimal oil import dependency vs Eurozone
- Banking sector surplus liquidity: Swiss banks hold excess CHF reserves → SNB can keep rates low without sparking inflation
- Inflation import channel inverted: Strong CHF = cheaper imports → CHF appreciation actually reduces inflation in Switzerland
SNB's "excessive appreciation" concern: If the CHF appreciates too much (e.g., EUR/CHF below 0.90), Swiss exporters (Nestle, Roche, Novartis, ABB) face revenue compression — their EUR/USD revenues convert to fewer CHF. The SNB monitors EUR/CHF actively and will sell CHF (buy EUR/USD) if it approaches the 0.90 level.
Reserve Bank of Australia (RBA) — 4.35% hold:
| RBA metric | Level (June 2026) |
|---|---|
| RBA cash rate | 4.35% (after 3 consecutive hikes in 2026) |
| Australia CPI | +4.1% YoY (well above 2–3% target) |
| Australia unemployment | 4.1% (low — labour market tight) |
| Australia wage growth | +4.5% YoY (above RBA comfort) |
| RBA Governor | Michele Bullock (hawkish, not declaring victory) |
The RBA pause vs the SNB hold — why different:
| Dimension | SNB | RBA |
|---|---|---|
| Reason for hold | Mission accomplished — CPI 1.3% within target | Tactical pause — CPI 4.1% well above 3% upper band |
| Next move probability | SNB first cut (if CHF appreciates too much) | RBA hike (if inflation doesn't fall) |
| Labour market | Low unemployment, wage growth moderate | Tight labour, +4.5% wages = inflation risk |
| Rate level vs neutral | 0.00% ≈ stimulative | 4.35% = restrictive but may not be enough |
| Communication tone | "Stable, watching CHF" | "Vigilant, will hike if needed" (Bullock) |
Bullock's hawkish press conference — key statement: "The Board remains highly vigilant to upside inflation risks. Services inflation remains sticky and our tightening cycle has not necessarily concluded. We will not hesitate to raise rates further if inflation expectations begin to drift."
This language is deliberately hawkish — not signalling a cut, explicitly keeping hike optionality open, and placing the burden of proof on inflation to decelerate.
📌 The Bottom Line
- spacex-spcx-ipo-2-97t-cursor-60b-acquisition-dilution: IPO $135/share ($1.77T) → Day 1 +19.2% to $2.11T → June 16 peak $2.97T (#2 globally behind Apple) → Cursor $60B all-stock acquisition → correction to $2.37T; 2% dilution from $60B all-stock; Cursor: 1M+ active developers, 30-40% code generated by Tab completion, last private $8B → 7.5× acquisition premium; strategic rationale: Starlink developer ecosystem + SpaceX 12K internal engineers + GitHub Copilot competitor; all-stock correction 4-reason: dilution + overpayment concern + lock-up overhang + integration risk.
- us-retail-sales-may-0-9pct-763b-gasoline-ecommerce-inflation-adjusted: Total +0.9% MoM to $763.7B (vs +0.5% expected), +6.9% YoY; gasoline +3.4% (price-driven, not volume); control group (ex-auto+gasoline) +0.5% MoM = annualised PCE ~+6% nominal/+2.5% real = too hot for Fed cuts; real retail (inflation-adjusted): 0.9% minus 0.35% monthly CPI = +0.55% real = still positive but overstated; e-commerce +12.2% YoY (vs total +6.9%) = 60 cents of new retail dollar going online; food services −0.4% (consumers cutting restaurant spending); electronics −0.8% (consumer electronics demand falling); 9/18 FOMC projecting another hike = retail data gives them ammunition.
- snb-0pct-hold-rba-4-35pct-pause-hawkish-bullock: SNB 0.00%: CPI 1.3% (within 0-2% target), mission accomplished, EUR/CHF 0.940 (CHF intervention trigger if <0.90), Switzerland: 57% hydro + 37% nuclear = energy independent, Swiss exports price-inelastic; "increased willingness" = CHF selling mandate if appreciates excessively; RBA 4.35%: CPI 4.1% (vs 2-3% target = 1.1-2.1pp overshoot), wages +4.5% (above comfort), unemployment 4.1% (tight labour market), Bullock "will not hesitate to raise" = explicit hike optionality; SNB vs RBA: mission accomplished vs tactical pause = very different holds.
📬 Stay Updated
Get global market analysis delivered to your inbox every week. Subscribe to our free newsletter →
Disclosure: This post contains affiliate links. If you purchase through our links, we earn a small commission at no extra cost to you. We only recommend products we believe in.
Enjoyed this post?
Get our weekly digest delivered free.
Share this post:
Knowelth is reader-supported. We may earn a commission from links in this article at no extra cost to you. Read our disclosure.
Related Posts

Fed Rate Split, $1T AI Capex Surge, and Gold's $4,400 Historic High: Mid-August 2026 Global Markets Brief
Fed Rate Split, $1T AI Capex Surge, and Gold's $4,400 Historic High: Mid-August 2026 Global Markets Brief Global financial markets in mid-August 2026 are navigating a complex intersection of central b…

Fed Rate Hold Amid Hawkish Dissent, AI Cloud Earnings Boom, and Oil Surges on Hormuz Tensions
Fed Rate Hold Amid Hawkish Dissent, AI Cloud Earnings Boom, and Oil Surges on Hormuz Tensions Global financial markets are navigating a high-stakes transition period marked by central bank monetary po…

Wall Street Tech Rally, Fed Rate Outlook Softens, and Gold Holds Above $4,000 Safe-Haven Milestone
Wall Street Tech Rally, Fed Rate Outlook Softens, and Gold Holds Above $4,000 Safe-Haven Milestone Global equity markets opened August 2026 on a resilient footing, propelled by robust Q2 enterprise so…