Zomato-Blinkit: Quick Commerce Unit Economics
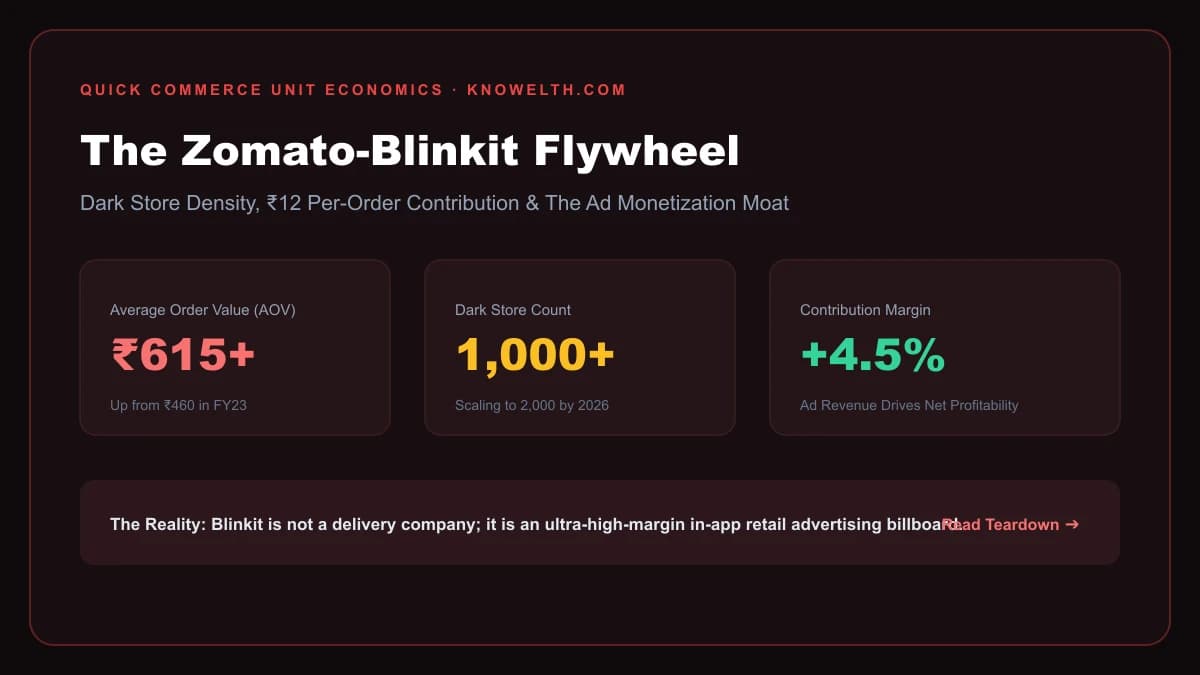
The Zomato-Blinkit Flywheel: The Unit Economics of 10-Minute Quick Commerce in India
Quick Summary: When Zomato acquired distressed grocery delivery platform Blinkit (formerly Grofers) in mid-2022 for ₹4,447 Crore ($568 Million), Dalal Street analysts widely condemned the deal as value-destructive capital misallocation. Fast-forward to 2026, and Blinkit has emerged as the crown jewel of Zomato's corporate valuation—consistently outpacing the core restaurant food delivery business in Gross Order Value (GOV) growth and dark store throughput. By replacing unviable multi-kilometer scheduled deliveries with a hyper-dense grid of 1,000+ localized dark stores (micro-fulfillment centers), Blinkit has engineered positive contribution margins across mature clusters. Behind the consumer illusion of "10-minute convenience" lies a ruthless logistics equation: monetizing high-frequency consumer baskets via FMCG brand advertising, surge handling fees, and rapid inventory turnover that is fundamentally disrupting traditional retail and kirana supply chains across urban India.
The In-App Retail Media Moat: Blinkit does not generate its net profits by charging delivery fees to consumers or negotiating 2% margins on staple onions. Its primary profit engine is Retail Media Advertising. Because consumers open the Blinkit app with immediate purchase intent (search-to-checkout in under 90 seconds), consumer brands (Unilever, Nestlé, Coca-Cola, Apple, boAt) pay premium slotting and search ad fees representing 3.2% to 4.5% of total Gross Order Value (GOV). This pure-margin digital ad income completely covers local warehouse rent and rider subsidies.
+---------------------------------------------------------------------------------------------------+
|                        THE BLINKIT HYPERLOCAL DARK STORE FLYWHEEL                                 |
+---------------------------------------------------------------------------------------------------+
                                                  │
         ┌────────────────────────────────────────┼────────────────────────────────────────┐
         ▼                                        ▼                                        ▼
+──────────────────────────+             +──────────────────────────+             +──────────────────────────+
| DARK STORE DENSITY       |             | ORDER FREQUENCY (AOV)    |             | AD MONETIZATION (HIGH GM)|
| • Radius: 1.5 – 2.0 km   |             | • Average Basket: ₹615+  |             | • In-App Brand Auctions  |
| • Picking Time: <150 sec |             | • General Merch & Tech   |             | • 3.5%–4.5% Take of GOV  |
| • 1,200+ Orders/Store/Day|             | • 24/7 Delivery Windows  |             | • 95%+ Gross Margin      |
| • Fixed Rent Fixed Base  |             | • Spontaneous Purchasing |             | • Direct Profit Booster  |
+──────────────────────────+             +──────────────────────────+             +──────────────────────────+
         │                                        │                                        │
         └────────────────────────────────────────┼────────────────────────────────────────┘
                                                  ▼
+---------------------------------------------------------------------------------------------------+
| SYNTHESIS: Positive Store-Level Adjusted EBITDA (>4.5%) Funding Greenfield Multi-City Expansion   |
+---------------------------------------------------------------------------------------------------+
🏬 1. The Dark Store Anatomy: How Blinkit Works Under the Hood
Unlike traditional supermarkets that require expensive high-street commercial storefronts, air-conditioned aisles, and customer billing counters, a Blinkit dark store is an austere, windowless warehouse located in low-rent basements, industrial bypasses, or rear alleys within a 1.5 to 2.5-kilometer radius of densely populated residential catchments.
Key Dark Store Specifications:
- Footprint: 3,000 to 4,500 square feet.
- Stock Keeping Units (SKUs): 7,000 to 10,000 distinct items (spanning fresh milk and vegetables to iPhone chargers, premium cosmetics, and small kitchen appliances).
- Algorithmic Heat-Mapped Shelving: High-frequency morning items (milk, bread, eggs) are positioned within 5 meters of the dispatch conveyor, reducing picker travel time to under 90 seconds per order.
- Order Throughput Threshold: A dark store reaches operational cash breakeven once it processes between 900 and 1,000 orders per day, a milestone mature tier-1 stores cross within 4 to 6 months of commissioning.
+---------------------------------------------------------------------------------------------------+
|                         BLINKIT ORDER FULFILLMENT LIFECYCLE (600 SECONDS)                         |
+---------------------------------------------------------------------------------------------------+
 Customer Checkout (T=0s) ──► Instant In-Store Picker Terminal Alert & Barcode Verification (T=45s)
                                              │
                              ┌───────────────┘
                              ▼
 Robotic Tote Packing & Weight Check (T=150s) ──► Hand-Off to Waiting EV Delivery Rider (T=180s)
                                              │
                              ┌───────────────┘
                              ▼
 Hyperlocal Transit (1.8 km Distance via E-Bike) (T=540s) ──► Doorstep Handover (T=600s / 10 Mins)
+---------------------------------------------------------------------------------------------------+
💰 2. Dissecting the Unit Economics: Anatomy of a ₹600 Basket
To evaluate whether quick commerce is a durable economic business model or a venture-capital-subsidized bubble, one must analyze the microscopic unit economics of an average customer order in an established metropolitan cluster (Delhi NCR, Mumbai, Bengaluru):
+---------------------------------------------------------------------------------------------------+
|                       BLINKIT UNIT ECONOMICS PER ORDER BREAKDOWN (FY 2025–26)                     |
+---------------------------------------------------------------------------------------------------+
| Metric / Transaction Component                       | Per Order Value (₹) | % of Gross Order Value|
+------------------------------------------------------+---------------------+----------------------+
| 1. Gross Order Value (Basket Size)                   | ₹615.00             | 100.0%               |
| 2. Total Commission / FMCG Take Rate (Gross Margin)   | +₹116.85            | 19.0%                |
| 3. Customer Delivery & Surge Handling Fees            | +₹21.50             | 3.5%                 |
| 4. In-App Brand Advertising Revenue (Retail Media)    | +₹24.60             | 4.0%                 |
+------------------------------------------------------+---------------------+----------------------+
| TOTAL REVENUE PER ORDER                              | 🏆 +₹162.95         | 26.5%                |
+------------------------------------------------------+---------------------+----------------------+
| 5. Delivery Rider Payout (Hyperlocal E-Bike)         | -₹52.00             | -8.5%                |
| 6. Dark Store Picking, Packing & Warehouse Labor     | -₹24.50             | -4.0%                |
| 7. Dark Store Lease Rent, Electricity & Cold Storage | -₹21.50             | -3.5%                |
| 8. Payment Gateway & Transaction Processing Costs    | -₹7.40              | -1.2%                |
| 9. Packaging Materials, Waste & Spoilage Allowance   | -₹9.25              | -1.5%                |
+------------------------------------------------------+---------------------+----------------------+
| TOTAL OPERATING EXPENSES PER ORDER                   | -₹114.65            | -18.7%               |
+------------------------------------------------------+---------------------+----------------------+
| NET CONTRIBUTION PROFIT PER ORDER                    | 🏆 +₹48.30          | 7.8% of GOV          |
+------------------------------------------------------+---------------------+----------------------+
As the table demonstrates, on an average order of ₹615, Blinkit generates ₹48.30 in positive contribution margin. The critical lever is the combination of high Average Order Value (AOV) and advertising revenue: when basket size crosses ₹500, delivery and warehouse labor become fixed costs that decline as a percentage of total ticket size.
🥊 3. The Multi-Category Pivot: Beyond Bananas and Coriander
Enjoyed this post?
Get our weekly digest delivered free.
The foundational insight discovered by Deepinder Goyal and Albinder Dhindsa was that delivering only low-margin fresh groceries (potatoes, onions, milk) caps gross margins at 12% to 14%, which cannot support rider payouts.
To overcome this constraint, Blinkit systematically broadened its catalog into high-margin lifestyle and electronics categories:
- Consumer Electronics & Accessories: Partnering directly with Apple, Samsung, Sony, and boAt to deliver iPhones, PS5 consoles, earbuds, and chargers within 10 minutes on festive release days. Electronics carry high absolute rupee gross profits per delivery.
- Beauty, Skincare & Luxury Personal Care: Stocking premium brands (L'Oréal, Minimalist, Cetaphil) that command 28% to 35% brand take rates.
- Festive & Spontaneous Merchandising: Monopolizing occasion-driven demand (Rakhi threads, Diwali gold coins, Holi gulal, Valentine's chocolates) where consumer price sensitivity is zero.
+---------------------------------------------------------------------------------------------------+
|                        BASKET MARGIN PROFILE BY PRODUCT CATEGORY                                  |
+---------------------------------------------------------------------------------------------------+
| Category                      | Average Gross Margin % | Share of Total Blinkit Mix (2026)        |
+-------------------------------+------------------------+------------------------------------------+
| Fresh Produce & Dairy         | 11% – 14% (Low)        | 22% (High Frequency Footfall Anchor)     |
| Packaged FMCG & Beverages     | 18% – 22% (Moderate)   | 44% (Core Repeat Volume)                 |
| Beauty, Skincare & Grooming   | 28% – 34% (High)       | 16% (Margin Expansion Driver)            |
| Small Electronics & Home Ware | 🏆 25% – 40% (Ultra)   | 18% (AOV Booster & Ticket Magnifier)     |
+-------------------------------+------------------------+------------------------------------------+
⚔️ 4. Competitive Moat Analysis: Blinkit vs Zepto vs Swiggy Instamart
The quick commerce arena in India has consolidated into an aggressive triopoly:
+---------------------------------------------------------------------------------------------------+
|                          INDIAN QUICK COMMERCE TRIOPOLY BENCHMARK MATRIX                          |
+---------------------------------------------------------------------------------------------------+
| Parameter / Operational Metric | Blinkit (Zomato)                 | Zepto                         | Instamart (Swiggy)            |
+--------------------------------+----------------------------------+-------------------------------+-------------------------------+
| Active Dark Store Count        | 🏆 1,000+ Stores                 | ~750 Stores                   | ~850 Stores                   |
| Monthly GOV Run-Rate           | 🏆 ~₹5,800 Cr                    | ~₹3,600 Cr                    | ~₹3,900 Cr                    |
| Average Order Value (AOV)      | 🏆 ₹615 – ₹630                   | ₹510 – ₹540                   | ₹480 – ₹510                   |
| Dark Store Breakeven %         | ~82% of Stores Cash Positive     | ~68% of Stores Cash Positive  | ~65% of Stores Cash Positive  |
| Corporate Balance Sheet Power  | 🏆 Zomato Net Cash >$1.5 Billion | Private VC Dependent          | Public Market Post-IPO Capital|
| Loyalty Subscription Tie-in    | Zomato Gold Cross-Platform       | Zepto Pass                    | Swiggy One Membership         |
+--------------------------------+----------------------------------+-------------------------------+-------------------------------+
Blinkit's structural advantage lies in cross-platform customer acquisition. Zomato funnels millions of food-delivery subscribers into Blinkit at zero marginal customer acquisition cost (CAC), whereas standalone competitors like Zepto must spend aggressively on paid performance marketing and social advertisements to acquire new transacting users.
⚠️ 5. Long-Term Vulnerabilities & Macro Risks
Despite extraordinary operational execution, quick commerce faces serious structural headwinds:
- Gig Economy Regulatory Tightening: Indian state governments (Karnataka, Maharashtra, Telangana) are actively formulating social security codes, mandatory health insurance, and minimum wage floors for platform gig workers. Any statutory increase of ₹15–₹20 per delivery drop compresses contribution margins unless passed on to consumers.
- Kirana Backlash & Antitrust Scrutiny: The Confederation of All India Traders (CAIT) has filed multiple petitions with the Competition Commission of India (CCI), alleging predatory pricing, deep discounting, and anti-competitive exclusive manufacturer arrangements.
- Inventory Depreciation & Cold-Chain Spoilage: Managing thousands of fragmented dark stores exposes the supply chain to local stockouts, fruit and vegetable spoilage, and working capital leakage if demand forecasting algorithms miscalculate local weather or festival spikes.
📌 Strategic Case Study Takeaways for Business Leaders
+---------------------------------------------------------------------------------------------------+
|                                  ACTIONABLE BUSINESS LESSONS                                      |
+---------------------------------------------------------------------------------------------------+
| Strategic Vector               | Core Business & Unit Economics Takeaway                          |
+--------------------------------+------------------------------------------------------------------+
| The Power of Density           | Geographically clustered volume reduces marginal delivery costs.  |
| Advertising as Profit Driver   | When margins on goods are thin, turn your app into a media network|
| Cross-Sell Synergies           | Existing user bases (Zomato) crush standalone competitors' CAC.   |
| Basket Size Expansion          | High-ticket items (electronics) make fixed delivery costs viable.|
+--------------------------------+------------------------------------------------------------------+
📫 Corporate Strategy & Valuation Teardowns
Subscribe to Knowelth for institutional-grade breakdowns of Indian consumer internet models, platform economics, and conglomerate capital allocation strategies.
Subscribe to Knowelth Executive Intelligence →
Disclaimer: This analysis is published strictly for business and educational evaluation and does not constitute investment advice or a recommendation to buy or sell Zomato Limited equities.
The insights, business case studies, and financial data presented on Knowelth are strictly for educational and strategic research purposes only. Knowelth and its authors are not SEBI-registered investment advisors or research analysts. Nothing published herein should be construed as personalized investment advice or a recommendation to buy or sell securities. Investments in the securities market are subject to market risks. Please conduct your own due diligence or consult a SEBI-registered financial planner before making investment decisions. Read our Editorial Policy.
Enjoyed this post?
Get our weekly digest delivered free.
Share this post:
Knowelth is reader-supported. We may earn a commission from links in this article at no extra cost to you. Read our disclosure.
Related Posts
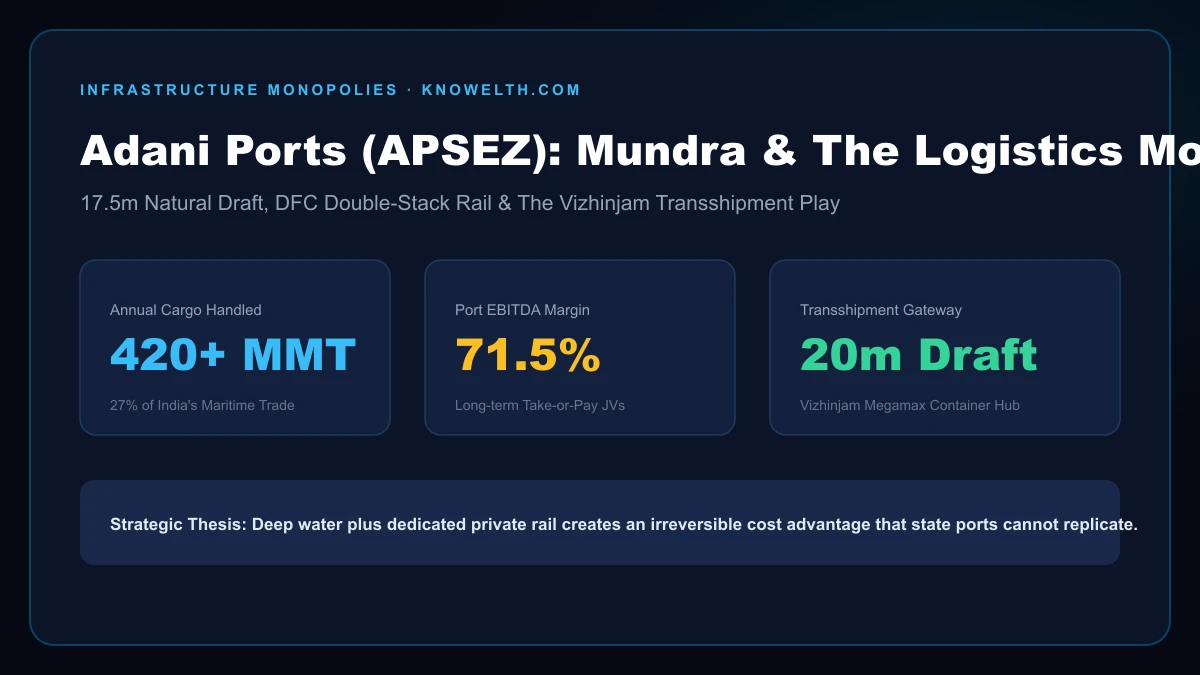
Adani Ports (APSEZ): Mundra Infrastructure & The Transshipment Moat
The Logistics Monolith: How APSEZ Built India's Unassailable Maritime Infrastructure Moat Executive Summary: Over the past two decades, Adani Ports and Special Economic Zone Limited (APSEZ) has execut…
Case Study: How an Independent Content Creator Built a $100,000 ARR Niche Financial Media Business with Zero Paid Ads
Case Study: How an Independent Content Creator Built a $100,000 ARR Niche Financial Media Business with Zero Paid Ads Quick Summary: In January 2024, Siddharth, an independent financial analyst and…
Case Study: Navigating the 2020 COVID Market Crash — How Asymmetric Rebalancing and Cash Deployment Delivered a 36% 4-Year CAGR
Case Study: Navigating the 2020 COVID Market Crash — How Asymmetric Rebalancing and Cash Deployment Delivered a 36% 4-Year CAGR Quick Summary: In March 2020, as the global COVID-19 pandemic unfolde…